Venture Funding Recovered on Paper. The Median Founder Did Not.
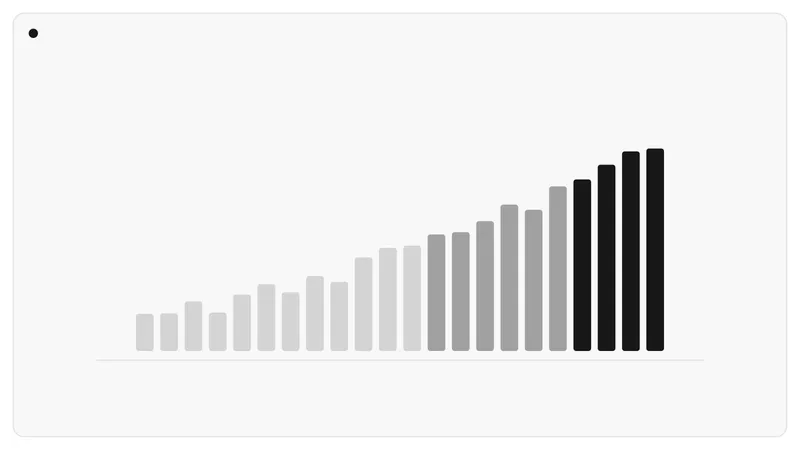
Aggregate dollars are up sharply. Deal count is flat and the median round is smaller, which means the recovery is concentrated in a handful of very large cheques.
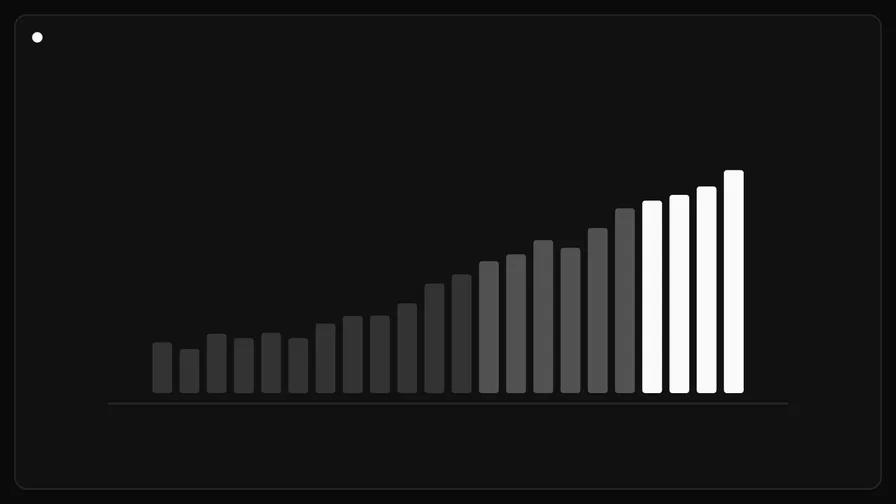
Every quarterly funding report this year has led with the same figure: total dollars deployed, up substantially year over year. It is an accurate number and a misleading headline. Strip out the largest deals and the picture reverses. Deal count is roughly flat, the median round has shrunk, and the time between rounds has stretched by about five months.
What happened is not a recovery. It is a concentration.
The arithmetic of a mean that moves without the median
When a small number of very large financings enter the denominator, aggregate dollars rise sharply while the typical experience of raising money gets harder. Both things are true at once, and only one of them makes the summary slide.
The pattern is visible in three places.
- Round size distribution. The top decile of deals accounts for a materially larger share of total dollars than it did three years ago. The bottom half accounts for less.
- Deal count. Flat to slightly down, depending on whose dataset you use and how they treat extensions and bridges. Nobody credible has it up meaningfully.
- Graduation rates. The share of seed-funded companies raising a Series A within 24 months has fallen. This is the number that actually describes founder experience, and it is the one least often reported.
The aggregate number is a fundraising document for the asset class. It is not a description of the market that founders are operating in.
Why bridges are doing the work rounds used to do
The clearest structural change is the normalisation of the inside round. Bridges, extensions, and structured follow-ons from existing investors now make up a much larger share of financings than they did in the last cycle.
This is rational behaviour from funds holding marks they do not want to reset, and it produces two effects worth naming. It keeps companies alive that would otherwise have failed, which delays the mark-down rather than avoiding it. And it shifts negotiating leverage decisively toward existing investors, because the alternative to their terms is often no term sheet at all.
Founders describe the consequence in consistent language: the round happens, the valuation is flat, the preference stack gets heavier, and the option pool gets refreshed out of common. The company survives. The founder’s economics do not.
What the concentration is buying
The large deals are not random. They cluster in capital-intensive infrastructure, where the cheque size is a function of what the business physically requires rather than investor enthusiasm.
That is a meaningful distinction. A very large financing for compute capacity or manufacturing is buying a fixed asset with a depreciation schedule. It looks like exuberance in an aggregate chart and like capital expenditure on a balance sheet. Our reporting on the packaging bottleneck in accelerator supply explains part of why those cheques are as large as they are.
The corollary is that the concentration is not evenly distributed across sectors either. Software businesses with ordinary capital needs are raising smaller rounds against tougher metrics, and the bar has moved from growth rate to demonstrated gross margin. As we found reporting on inference costs, that second requirement is genuinely difficult for a category of products that looked healthy under the old bar.
The number to watch instead
If you want one series that describes the market founders actually face, use the seed-to-Series-A graduation rate on a trailing 24-month basis, split by cohort year. It captures survival, it is not distorted by outliers, and it leads the aggregate figures by about a year.
It is currently below its 2021 peak by a wide margin and has been flat for three quarters. That is the recovery.
Published . Corrections and clarifications: our policy.